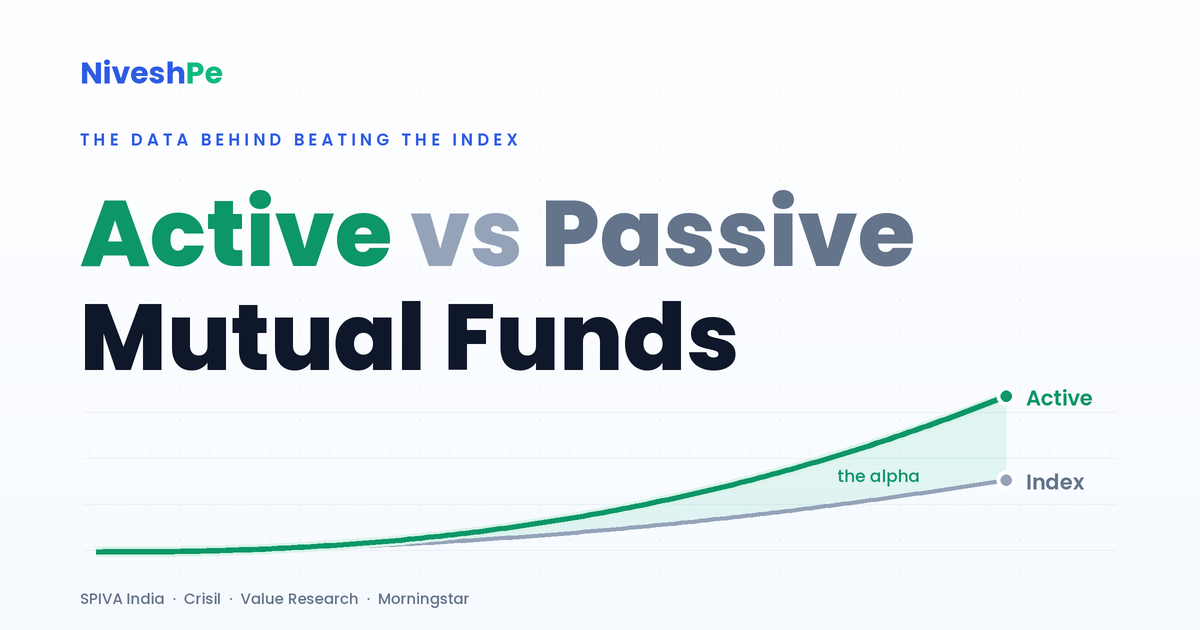
"Just buy index funds. Most active funds can't beat the market." It is the most repeated line in Indian personal finance, and it is only half true. The latest SPIVA India scorecard shows 84.4% of active large cap funds trailed their benchmark over five years, so on large caps, the sceptics have a point. But the same scorekeeper shows a majority of active mid and small cap funds beat their index in 2025 - their best year since 2014 - and on risk-adjusted returns, 76% beat it over five years. The winners are not marginal either: ₹10,000 at inception in one flexi cap fund grew to ₹21.56 lakh against ₹5.67 lakh for its benchmark. The catch is that winners rotate, and investors chasing them give up 2.5-5.8 percentage points a year to bad timing. This article lays out the full data: where active management genuinely wins, how the consistent 20% of funds are found before they top the charts, and when to rebalance out of a fund that is slipping.
The Half of the Claim That Is True
Start with the concession, because the data demands it. Per the SPIVA India Year-End 2025 scorecard from S&P Dow Jones Indices, 75.0% of active large cap funds trailed the S&P India LargeMidCap over calendar 2025, 74.2% over three years, 84.4% over five and 76.3% over ten. In 2025 itself the index rose 8.9% while large cap funds averaged 7.3% on an equal-weighted basis.
Large cap: share of active funds that trailed the benchmark
Benchmark: S&P India LargeMidCap. Underperformance is measured on absolute returns, net of fund fees, against a cost-free index. Even so, the large cap verdict is clear.
Large cap is genuinely hard to beat, and it has been since 2018 for structural reasons: SEBI's recategorisation forced these funds to hold at least 80% of assets in the top 100 stocks, and benchmarking shifted to Total Return Indices, which include dividends. Two crutches removed at once - in 2018, the first full year of both rules, 92% of large cap funds underperformed.
Why 2018 changed large cap forever
Large cap underperformance is not a mystery of skill; it is a consequence of structure.
And the squeeze is tightening. India's large caps are covered by hundreds of analysts, institutional ownership keeps rising, and mispricing gets arbitraged away in hours. Industry veterans peg large cap alpha at 2-3 percentage points today, down from roughly 8 a few years ago. If your entire equity exposure is large cap, the index is a hard opponent, and the probability-versus-alpha-spread trade is simply not rewarding. But here is the thing the "passive always wins" crowd never says next: large cap is not where wealth gets built.
Where Active Managers Actually Earn Their Fee
Move down the market cap curve and the story inverts. Mid and small caps are where analyst coverage thins out, information asymmetry is real, and stock-picking has room to work. The scoreboard agrees. Per SPIVA India, a majority of active mid and small cap funds beat their index in 2025 - their best relative year since 2014. In the first half of 2025, only 34.5% underperformed, meaning 65.5% beat the S&P India SmallCap, the only category in the report where the majority outperformed. And once you adjust for risk, the picture strengthens dramatically: over five years, 76% of mid and small cap funds beat the index on risk-adjusted returns, and roughly half still beat it over a full decade.
Mid & small cap: share of active funds that BEAT the index
Benchmark: S&P India SmallCap. Risk-adjusted figures divide returns by volatility, the fairer lens for a category where funds often run less risk than the index. Full-year 2025: majority outperformance, best since 2014 (SPIVA India Year-End 2025).
Category averages tell the same story in plain returns. In calendar 2024, the flexi cap category averaged 20.5% against 16.2% for the Nifty 500 TRI, and mid cap funds averaged 28.7% against 24.5% for the Nifty Midcap 150 TRI. The average fund beat the index, not just the stars. ELSS was the only category where a majority of funds beat the benchmark in 2024 as well. This is not cherry-picking a good year for the argument; it is the pattern SPIVA itself documents whenever the market broadens beyond ten index heavyweights.
The average active fund beat the index, not just the toppers
Bars scaled to the highest value shown. A 4 point category-average edge in a single year is large; compounded, it is the difference between portfolios.
Where the index wins, and where active earns its fee
"Go active" assumes the selection and monitoring system this article lays out, not blind fund-picking. Sources: SPIVA India, category average and TRI data cited above.
What Alpha Looks Like in Rupees
Percentages understate what compounding does with even modest alpha, so put it in rupees. These three funds have run for 14 to 27 years against their Total Return Index benchmarks. They are historical illustrations of how wide the dispersion in outcomes is, not recommendations - the next section is precisely about why yesterday's winner list is not a buy list.
Fund vs benchmark: the compounding gap of picking right
Bars scaled within each fund. Past performance, shown to illustrate dispersion; it may not be sustained and these are not recommendations. Nippon benchmark value estimated from its published 14.8% CAGR over the same period.
Look at the middle case closely, because it is the honest one. HDFC Mid-Cap Opportunities earned "only" 2.3 points a year over its benchmark. Unremarkable? On a ₹10 lakh investment over those 18 years, that 2.3 point gap is roughly ₹53 lakh of extra wealth. Nippon India Small Cap ran 8 points ahead of its benchmark for 14 years and, per freefincal's rolling-return analysis, beat the index in 1,891 out of 1,891 rolling five-year windows. Alpha of this size does not exist in large cap. It demonstrably exists here.
What You Actually Buy When You Buy the Index
The index is marketed as the neutral, diversified choice. It is neither. Buying the Nifty 50 today means the top 10 stocks are 55-60% of your money, financial services alone is roughly 38%, and the single largest stock is about 9%. You hold that concentration whether you like it or not, with no manager mandated to step aside from an overvalued sector. Indian passive products carry their own frictions too: tracking error and tracking difference that widen in less liquid segments, ETF premiums and discounts to NAV, and a still-shallow factor and smart-beta shelf. Passive is a choice with its own risks, not the absence of choice.
The "diversified" index: one bet, ten stocks deep
Index investing means accepting this sector and stock concentration by construction. An active mandate can diversify away from it; the index cannot.
The Catch: Winners Do Not Stay Winners
Here is where the honest version of the active case parts ways with the naive one. Alpha exists, but it rotates - violently. Hold the same mid or small cap fund on autopilot for a decade and the odds flip against you: on raw absolute returns, 82% trailed the index over the 10 years to June 2025. The 5-year winner and the 10-year laggard are often the same fund at different ages.
A decade-long Value Research study of flexi cap funds found that no fund held the #1 rank for two consecutive years, and in five of the ten years, the previous year's chart-topper fell out of the top quartile entirely. In freefincal's rolling-return work, only 3 of 28 mid cap funds beat the Nifty Midcap 150 TRI in at least 70% of rolling five-year windows. Roughly one fund in five is consistently good. The rest take turns looking good.
The leaderboard is a lava lamp
Both funds topped charts. Both punished investors who arrived late and stayed on autopilot. This is not an argument against active; it is the argument for monitoring.
The Costliest Mistake Is the Human One
Rotation would be survivable if investors sat still. They do not. Axis Mutual Fund's 20-year study (2003-2022) found the average equity fund delivered 19.1% a year while the average investor in those very funds earned 13.8%. A 5.3 point annual gap, created almost entirely by buying after a fund tops the charts and selling after it disappoints. Morningstar India pegs the same behaviour gap at 2.5 to 5.8 points across horizons. On ₹10 lakh over 20 years, 5.3 points a year is roughly ₹1.9 crore of foregone wealth - more than any expense ratio, any exit load, any advisory fee you will ever pay.
The funds earned it. The investors did not keep it.
So the Question Was Never Active vs Passive
Put the three facts together. One: in mid, small and flexi cap, active funds beat the index often enough, and by enough, to be worth pursuing. Two: the winners rotate, so buy-and-forget squanders the edge. Three: undisciplined switching destroys more value than fees ever will. The conclusion writes itself - the real debate is not active versus passive; it is systematic versus casual. The same Value Research decade of data makes the point with one comparison: portfolios built by chasing each year's chart-topper went on to beat the index in only 48% of subsequent rolling five-year windows. The handful of funds identified by long-run consistency beat it in 79%.
Two ways to pick active funds. Only one of them works.
A coin flip, bought at a premium of hype.
Same category, same decade, different method.
The alpha was there for both groups of investors. The method decided who captured it.
How to Find the Consistent 20%
Selection, done on evidence rather than star ratings and last year's tables, looks like this. Screen on rolling-return consistency: funds that beat their Total Return Index in 60-70% or more of rolling three-to-five-year windows, across market cycles, not point-to-point returns from a lucky start date.
Verify the process and the people: long manager tenure and a stable, documented mandate - the durable outperformers above were each run by the same manager for a decade or more. Check AUM discipline, because size is the enemy of small cap alpha: academic work on 237 Indian schemes found fund size and rapid asset growth predict weaker future performance, and in CY2020 the five smallest small cap funds beat the five largest by roughly 19 percentage points.
Buy direct plans to recover the 0.3-1.25% trail. And hold 2-3 funds per category with low portfolio overlap, because even a great manager can have a bad style-cycle.
Five filters between you and the consistent 20%
Each filter has data behind it, and none of it requires predicting next year's topper. It requires measuring what is already measurable.
When to Exit: Signals, Not Sentiment
Selection gets you in. Rebalancing keeps you in the right funds - and it is the step almost everyone skips, which is exactly why the 5-year mid/small beat-rate looks so much better than the 10-year one. Hold any fund for a decade without review and you will, statistically, ride at least one genuine decay all the way down. The discipline is to act on three specific signals and refuse to act on everything else.
Three exit signals, one non-signal
The non-signal: a different fund topping last year's chart. Switching for that reason alone is the behaviour gap in action - the 48% path. If your fund still clears the consistency, process and AUM filters, a rival's hot year is noise.
One more thing rebalancing is not: guesswork about market tops and bottoms. It is fund-level hygiene on a schedule - review annually against the TRI benchmark and category peers on rolling three-year numbers, act only when a signal fires, and document why. If you are fully DIY with no time for this, indexing is the honest default, and in large cap it is the right one for everybody. But if you are paying a wealth manager a fee and receiving an index-hugging portfolio in the very categories where the data shows active managers earn their keep, that is worth a hard question: what exactly is the fee buying?
The Verdict: Chosen Right, Active Is the Way Forward
The data does not say "active beats passive". It says something more useful: in the categories where wealth compounds fastest, well-chosen active funds have beaten the index by margins worth lakhs - and capturing that alpha is a job of selection, monitoring and disciplined rebalancing, not of faith in a fund house or a chart.
Three ways to invest for alpha. Only one is a system.
For investors who invest for returns, the conclusion from the data is clear. In mid, small and flexi cap, the alpha is real, persistent enough to matter, and large enough to change outcomes by lakhs and crores over a working life. What the data equally insists on is that this alpha goes to investors who run a system - one that answers two questions continuously: how do you find the consistent 20% before they top the charts, and when do you exit as a fund slips, without becoming the panic seller? Get those two right, and active is not just viable. It is the way forward.
Practical takeaway: Concentrate your active allocation where the beat-rates are highest - mid, small and flexi cap. Screen on rolling consistency (60-70%+ of windows), manager tenure and AUM discipline, in direct plans, across 2-3 low-overlap funds per category. Review annually on rolling 3-year numbers against the TRI. Exit on process, governance or AUM signals; never on a rival's hot year. That is the whole game.
This is precisely the system NiveshPe runs for every portfolio - Orbit AI screens funds on consistency, watches every holding daily for drift, governance and structural signals, and rebalances on evidence rather than emotion. HNI-grade, actively managed advisory, whatever your ticket size.
Disclaimer: Mutual fund investments are subject to market risks. Read all scheme related documents carefully. Past performance, including the fund examples cited, is not indicative of future returns; named schemes are historical illustrations, not recommendations. Data is from S&P Dow Jones Indices (SPIVA India), AMFI, Crisil, Value Research, Morningstar India, freefincal and cited media reports, as of their respective publication dates. This article is educational and not investment advice; consult a registered advisor before investing.