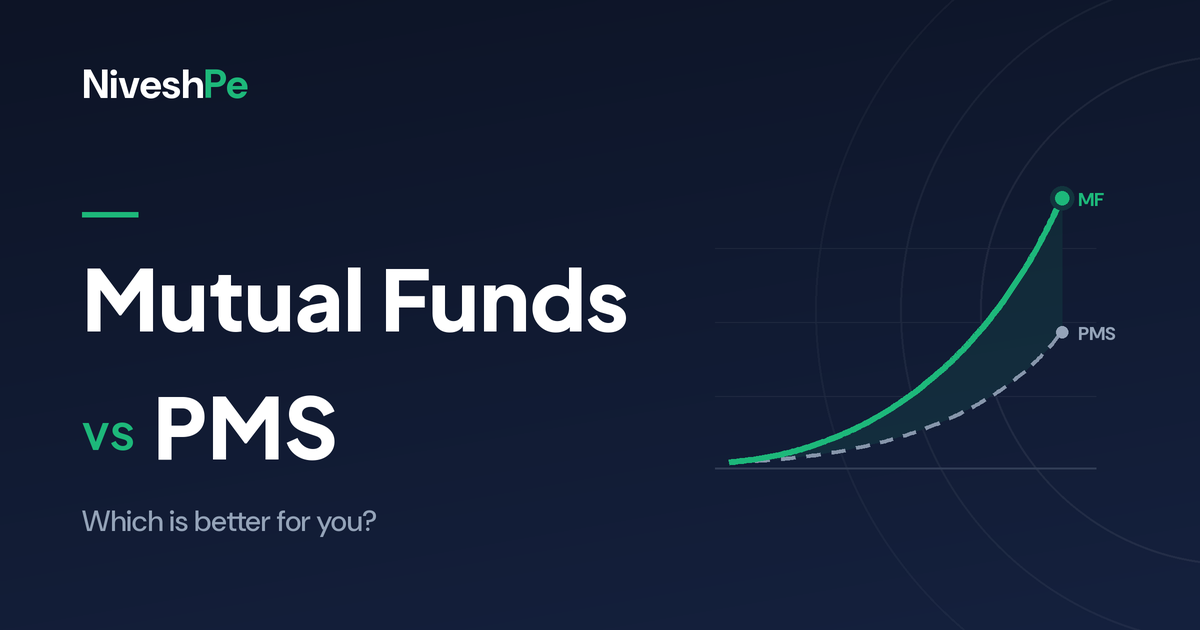
Portfolio Management Services promise exclusivity, personal attention and market-beating returns - for a minimum ticket of ₹50 lakh and an all-in cost that can cross 4% a year. The hard numbers tell a different story. Because every PMS trade is taxed in your hands while a mutual fund defers tax until you redeem, a PMS must out-earn a comparable mutual fund portfolio by roughly 2 percentage points every single year just to break even. On a ₹10 crore portfolio over 10 years with identical gross returns, the mutual fund investor walks away with ₹86 lakh more. Add survivorship bias in reported PMS returns, a benchmark loophole that lets mid-cap strategies compare themselves to large-cap indices, and best-to-worst gaps exceeding 20 percentage points in a single year, and the case gets stronger still. India's mutual fund industry now manages ₹82.03 lakh crore across 27.39 crore folios per AMFI's early-2026 data, against roughly ₹8.45 lakh crore in PMS once EPFO money is excluded. This article breaks down the structure, costs, taxation and performance evidence - and explains why a structured, professionally managed mutual fund portfolio is the smarter default for almost every investor.
PMS and Mutual Funds: Two Very Different Machines
A Portfolio Management Service is a SEBI-registered offering under the SEBI (Portfolio Managers) Regulations, 2020, where a professional manager runs a portfolio of stocks held directly in your own demat account. In the dominant discretionary format - roughly 85% of PMS assets and 95% of clients - the manager decides and executes trades without asking you each time. The regulatory minimum is ₹50 lakh per strategy, raised from ₹25 lakh in 2020, and every portfolio manager must maintain a net worth of at least ₹5 crore.
A mutual fund works on the opposite principle. Money is pooled into a trust, you own units rather than the underlying shares, and SEBI's mutual fund regulations enforce diversification (generally a 10% cap on any single stock), daily NAV disclosure and monthly public portfolio statements. Entry starts at ₹100-500 through SIPs.
The scale gap says a lot about which structure India actually trusts. The mutual fund industry managed ₹82.03 lakh crore as of February 2026, growing 27.1% year on year per AMFI, across 27.39 crore folios. PMS, once you strip EPFO and provident fund money out of the headline figure, manages roughly ₹8.45 lakh crore for just over 2 lakh discretionary clients (SEBI, January 2026). And while every mutual fund's NAV and portfolio are public, PMS reports go privately to clients at least quarterly. There is no public, comparable record of how a PMS has actually performed before you sign the cheque.
One pools your money. The other puts shares in your own name.
Which structure India actually trusts
Mutual fund figures: AMFI, February 2026. PMS figures: SEBI, January 2026. Bars are drawn to true scale — the PMS client bar is a sliver because it is one.
Structure at a glance
✓ Mutual fund wins 5 of 7| Parameter | Curated Mutual Fund Portfolio | PMS |
|---|---|---|
| Minimum investment | ₹100-500 via SIP; no minimum for a structured portfolio | ₹50 lakh per strategy |
| All-in annual cost | ~0.5-1.2% (direct plans) | 2-4%+ (fixed + performance fee + GST + costs) |
| Taxation | Only on redemption; internal churn untaxed | Every manager trade taxed in your hands that year |
| Liquidity | Daily NAV, T+1/T+2 redemption | Exit loads up to ~3% in year one |
| Transparency | Daily NAV, monthly public portfolios | Private reports, at least quarterly |
| Diversification | SEBI-mandated (10% single-stock cap) | Concentrated positions allowed |
| Customisation | At portfolio level (allocation, fund mix) | At security level (bespoke mandates) |
On paper, PMS sells three things mutual funds cannot: concentration (no single-stock cap), security-level customisation, and direct access to the manager. The question is what you pay for those three things - in fees, in tax, and in risk. Let us take them one at a time.
The Cost Stack: What Each Rupee of Advice Really Costs
A PMS bill has more line items than most investors expect. The fixed management fee typically runs 1.5-2.5% a year, plus 18% GST. Many strategies layer on a performance fee of 10-20% of profits above a hurdle of 8-10%, governed by a high-water mark. On top sit brokerage at actuals, custody, audit and operating expenses, entry loads of 1-3% through the distributor route, and exit loads of up to about 3% in the first year. Real-world menus make the point: Motilal Oswal at roughly 2-2.5% fixed plus 0.3% brokerage plus a 1-2% exit load; ASK at 2.5% fixed, or 1.5% plus 20% above a 10% hurdle; Kotak at 2.5% fixed plus a 1-3% exit load.
A curated portfolio of direct-plan mutual funds costs roughly 0.5-1.2% all-in. SEBI's revised Base Expense Ratio caps for open-ended equity schemes run from 2.10% for the smallest funds down to about 0.95% for the largest, and direct plans strip out the 0.5-1.5% distributor commission entirely. No performance fees. No entry loads. Exit loads are negligible beyond short holding windows.
Both routes, drawn on the same 0–4% scale
The mutual fund route has one cost head. The PMS route has six, and only the first is quoted up front.
Three real PMS fee structures
Cost head by cost head
✓ Roughly 3× cheaper| Cost Head | Curated MF Portfolio (Direct) | Typical PMS |
|---|---|---|
| Management fee | 0.5-1.2% all-in expense ratio | 1.5-2.5% + 18% GST |
| Performance fee | None | 10-20% of profits above 8-10% hurdle |
| Entry / exit charges | Nil / negligible | Entry 1-3% (regular route); exit up to ~3% in year one |
| Other costs | Included in expense ratio | Brokerage, custody, audit, operating expenses |
Same strategy. Same gross returns. Two fee structures.
₹11.76 lakh paid in fees
₹31.41 lakh paid in fees
Over ₹13 lakh of that was taken in a single good year.
The performance fee trap: Capitalmind tested its own Adaptive Momentum strategy over 6 years on a ₹1 crore start. A flat 1% fee cost ₹11.76 lakh in total and left the investor with ₹2.82 crore. A 20% performance fee above an 8% hurdle cost ₹31.41 lakh - including over ₹13 lakh in a single good year - and left ₹2.58 crore. Same strategy, same gross returns, ₹24 lakh less in hand purely because of the fee structure. Performance fees front-load costs in strong years and quietly erode compounding.
Taxation: The 2% Handicap PMS Cannot Escape
Costs are visible. The bigger drag is invisible until you file your returns. A mutual fund is a pass-through vehicle under Section 10(23D) of the Income Tax Act: the fund pays no tax when it buys and sells inside the scheme, and you are taxed only when you redeem - 20% on short-term equity gains, 12.5% on long-term gains above the ₹1.25 lakh annual exemption. Until redemption, the entire pre-tax corpus keeps compounding, uninterrupted.
In a PMS, the securities sit in your name, so every trade the manager makes is a taxable event in your hands that year - potentially dozens or hundreds of events annually in an actively churned portfolio. Dividends are taxed at your slab. You must pay advance tax quarterly on realised gains, and filing becomes meaningfully more complex.
Where those trades land on your tax return
Equity LTCG is taxed at 12.5% above the ₹1.25 lakh annual exemption; STCG at 20%. Dividends in a PMS are taxed at your slab rate.
How much does this cost? Consider the widely cited worked example from the NJ family of studies: ₹10 crore invested for 10 years, identical gross returns of 12.62% (AMFI's standardised assumption), 50% annual churn.
₹10 crore, 10 years, identical gross returns of 12.62%
✓ ₹86 lakh ahead| ₹10 Crore, 10 Years, Identical Gross Returns | Mutual Fund Route | PMS Route |
|---|---|---|
| Corpus after 10 years | ₹29.97 crore | ₹29.11 crore |
| Total tax paid | ₹86 lakh less | ₹86 lakh more |
| Reason | Tax deferred until redemption | Tax paid on every trade, every year |
Nothing separates these two lines except when the tax is paid
Curves interpolate the start and end values of the worked example at a constant rate; the annual path is illustrative, the endpoints are not.
Across multiple published studies, the tax drag on PMS works out to roughly 112-197 basis points every year depending on churn and the short-term/long-term gains mix. Even a PMS provider's own worked example, run at 100% annual churn, concedes a 112 basis point post-tax drag.
The rule of thumb from Wright Research: to match a mutual fund portfolio earning 12%, a PMS must deliver roughly 13.97%. That is about 2 percentage points of extra return required every year - before the manager has added a single rupee of genuine alpha.
Where each route has to finish, just to tie
Even a PMS provider's own worked example, run at 100% annual churn, concedes a 112 basis point post-tax drag — the bottom of this range, not the top.
Two honest caveats. First, PMS does hold one genuine tax lever: because gains and losses sit in your own hands, losses can be set off and carried forward, and tax-loss harvesting is possible. Second, rebalancing a mutual fund portfolio is also taxable - every switch between schemes books gains. This is precisely why structure matters: a well-managed portfolio rebalances sparingly, on drift thresholds rather than on a calendar, and sequences exits to use the ₹1.25 lakh annual LTCG exemption. The mutual fund's tax edge is largest when the portfolio is deliberately built to protect it.
Performance: What the Data Actually Shows
PMS marketing leads with spectacular numbers, and some of them are real. Per PMS Bazaar, the top 10 PMS strategies delivered over 20% CAGR across the 10 years to July 2024, against roughly 12.44% for the Nifty 50 TRI, and the average of 60 ten-year strategies was about 17.35%. The industry claims nearly 79% of approaches beat their benchmark over a decade. Three problems undermine the headline.
The numbers PMS marketing leads with — and some of them are real
The industry claims nearly 79% of approaches beat their benchmark over a decade. Three problems undermine the headline.
Problem 1: Survivorship Bias
Reported averages include only the strategies that survived; the closed and failed ones quietly drop out of the data. Marcellus is the cautionary tale - its flagship portfolios underperformed benchmarks for roughly three years, India AUM fell from a peak of about ₹12,500 crore to ₹3,264 crore, and founder Saurabh Mukherjea publicly acknowledged the failure to beat the market over that period. Yesterday's star manager is often tomorrow's mean reversion.
The average is calculated across the solid bars only
Illustrative bars. Founder Saurabh Mukherjea publicly acknowledged the failure to beat the market over that period.
Problem 2: The Benchmark Loophole
SEBI has allowed equity PMS to benchmark against only the broad BSE 500 or Nifty 50 - so a mid-cap strategy can claim victory over a large-cap-heavy index while trailing its true category. A Moneycontrol analysis of calendar year 2024 found the gap is anything but academic:
Moneycontrol analysis, calendar year 2024
Change the benchmark, change the story| Segment (CY24) | Beat Broad BSE 500 TRI | Beat Their True Category Index |
|---|---|---|
| Mid-cap PMS (22 strategies) | 14 of 22 | Only 6 of 22 |
| Small-cap PMS (18 strategies) | 14 of 18 | Only 8 of 18 |
The same strategies, scored against two different yardsticks
Problem 3: Dispersion
In FY25, large-cap PMS averaged just 5.52% against 6.65% for the Nifty 50 TRI, and in several segments the best-to-worst gap exceeded 20 percentage points. In the March 2026 correction, the best equity PMS gained 1.34% while the worst fell 22.08%. Choosing a PMS is not buying a category - it is betting on one manager, in advance, using private data. That is a lottery ticket, not a strategy.
Picking a PMS is not buying a category. It is betting on one manager.
In several segments the best-to-worst gap exceeded 20 percentage points. You have to pick the right manager in advance, using private data.
To be fair, active mutual funds are no alpha machine either. Per SPIVA India's Year-End 2025 scorecard, 76.3% of active large-cap funds underperformed their benchmark over 10 years, along with 82.9% of ELSS and 79% of mid- and small-cap funds. But that finding points towards the same conclusion, not away from it: the winning move is not chasing stars in either wrapper. It is owning a low-cost, asset-allocated, thoughtfully constructed portfolio inside the structure with the better cost and tax mathematics. That structure is the mutual fund.
Share of active mutual funds that underperformed their benchmark
The Behaviour Gap: Why Structure Beats Selection
One more number settles the "managed" part of this debate. Axis Mutual Fund's study of 2003-2022 found that while equity funds themselves delivered 19.1% annualised, the average investor in those very funds earned just 13.8% - a 5.3 point annual gap created by mistimed entries and exits. Disciplined SIP investors captured 15.2%. The product was fine. The behaviour was not.
The product was fine. The behaviour was not.
This is what a structured, professionally managed mutual fund portfolio actually fixes. Not stock-picking heroics, but the system around your money: a written asset allocation across equity, debt and gold matched to your goals and horizon; deliberate fund selection instead of a pile of 15 overlapping schemes; threshold-based rebalancing that acts only when weights drift meaningfully, minimising taxable churn; exit sequencing that harvests the ₹1.25 lakh LTCG exemption every year; and a steady advisory hand when markets fall 20% and every instinct says sell.
Not stock-picking heroics. The system around your money.
Each step closes one of the gaps in the chart above. None of them requires picking a winning stock.
The quiet irony: discipline, personalisation and a manager who knows your goals are exactly what PMS marketing sells - behind a ₹50 lakh minimum and a 2-4% cost stack. A structured mutual fund portfolio delivers the same discipline at a fraction of the cost, with a permanent tax advantage, whether you are investing ₹5,000 a month or ₹5 crore.
When Does PMS Actually Make Sense?
PMS is not useless - it is a specialist tool. It earns a place, as a satellite of 10-25% of your equity sleeve rather than the core, only when three gates are cleared. One, your investable wealth is comfortably above ₹1 crore, so the ₹50 lakh minimum does not over-concentrate you in a single strategy. Two, you genuinely need customisation or concentration a mutual fund cannot offer - a large single-stock conviction, a bespoke exclusion list, estate-planning considerations. Three, you can identify and monitor a top-quartile, process-driven manager with a long, audited, survivorship-honest record - and even then, negotiate a fixed fee rather than a performance fee, and insist on the true category benchmark, not the Nifty 50.
Three gates. All three must clear.
Where PMS sits in the equity sleeve
One footnote worth tracking: SEBI's 2025-26 review of PMS regulations may lower the ₹50 lakh minimum and widen investment options, so verify current thresholds before committing.
If any gate fails - and for most investors the third one always does, because picking the next decade's winning manager in advance is precisely the skill nobody has reliably demonstrated - the default answer stands. One footnote worth tracking: SEBI's 2025-26 review of PMS regulations may lower the ₹50 lakh minimum and widen investment options, so verify current thresholds before committing.
The Verdict: Structured Beats Exclusive
The real choice was never mutual funds versus PMS. It is structured versus unstructured. An unmanaged pile of funds loses to the behaviour gap. A PMS loses to fees, tax drag and manager risk. A structured, professionally managed mutual fund portfolio - written allocation, curated funds, threshold rebalancing, tax-aware exits - beats both for the overwhelming majority of Indian investors.
Three ways to hold Indian equity. Only one of them is a system.
The arithmetic is not close. A PMS must out-earn a comparable mutual fund portfolio by roughly 2 percentage points every year just to break even after fees and taxation, in a market where most strategies cannot reliably beat their own category index. Meanwhile the mutual fund structure hands you daily liquidity, public transparency, SEBI-mandated diversification and a tax deferral advantage that compounds silently, year after year.
Practical takeaway: Make a curated, asset-allocated mutual fund portfolio your core, whatever your ticket size. Keep all-in costs near 0.5-1.2%, write down your allocation, rebalance on thresholds rather than dates, and harvest the ₹1.25 lakh LTCG exemption each year. Consider PMS only above ₹1 crore of equity wealth, only as a satellite, and only on a fixed fee. If a PMS cannot credibly promise 2% a year of extra return after everything, it has no mathematical case.
This is exactly what NiveshPe was built for - a structured, professionally managed portfolio with a dedicated advisor, on the principle that you don't need ₹1 crore to be treated like a ₹1 crore investor. HNI-grade advisory, without the ₹50 lakh gate.
Disclaimer: Mutual fund investments are subject to market risks. Past performance does not guarantee future returns. Tax rules are subject to change. This article is educational and not investment advice; consult a registered advisor before investing.